Fully Automatic Analysis
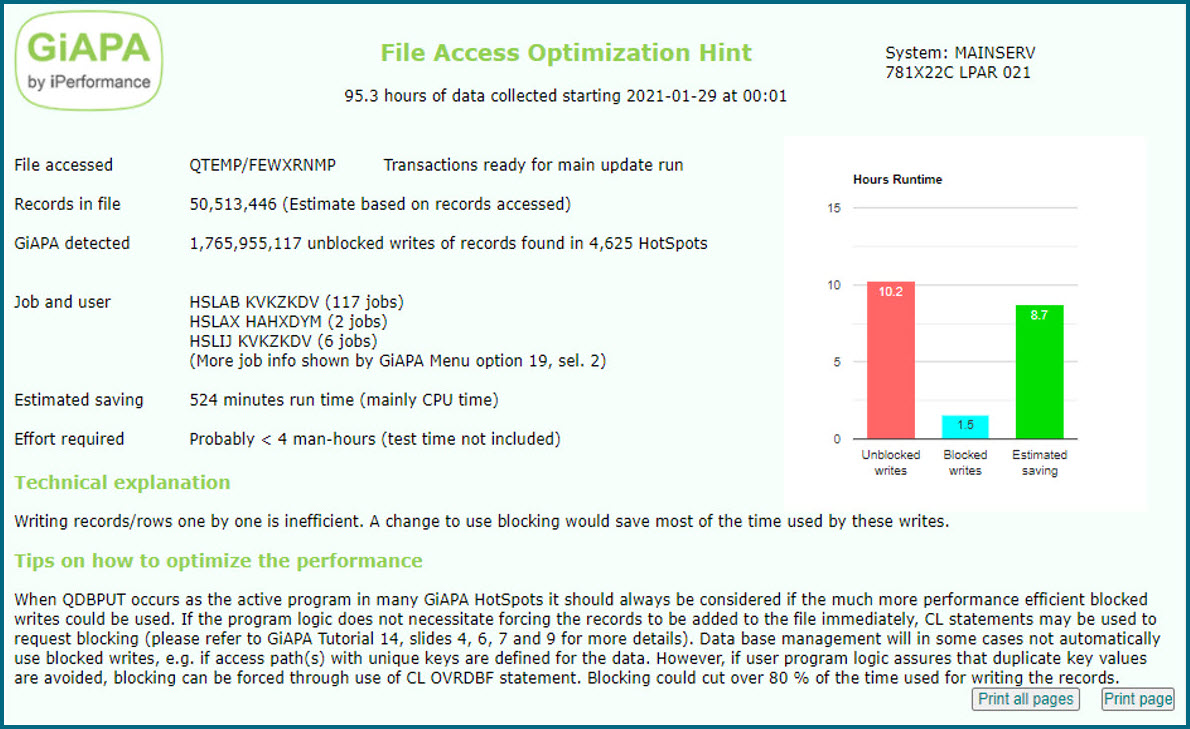
This is the most advanced GiAPA feature, catching up to 80 % of the commonly seen inefficiencies in average commercial applications. We show here one typical example of often found inefficiencies in applications believed to run OK - which they of course do, meaning that the results produced are correct. But a small and easy modification can give a major performance improvement. The automatically generated description contains all the specifications needed by the programmer to do the change.

Checking I/O Efficiency
In commercial applications data base I/Os are almost always the bottleneck, on average accounting for somewhat more than 2/3 of all resource usage. Today the processors are so fast that even complex calculations within the business logic only rarely consume noticeable CPU.
If anyone should doubt this fact then just remember that even when several batch jobs are active at the same time, the CPU usage will normally still be far from 100 % - the reason being that we almost all the time are awaiting I/Os.
A job could use 100 % CPU if all data all the time was available in memory when needed by the programs. This is not the case - the bottleneck is the I/Os where data is read into or written from main storage.
Remembering this fact it can hardly surprise that the most rewarding optimization in most cases spells speeding up I/Os, which again means reducing the number of accesses.
Surprising is however that many (i.e., most) programmers never were trained to consider this fact. On the contrary, the saying goes that “Machines are so fast today that performance is no concern”.
GiAPA is to our knowledge the only tool that analyzes file accesses down to relative record number. Doing this we obtain astonishing successes, often able to find very significant speed-up potential within applications believed to run efficiently.
Example 2 is also rather automatic:
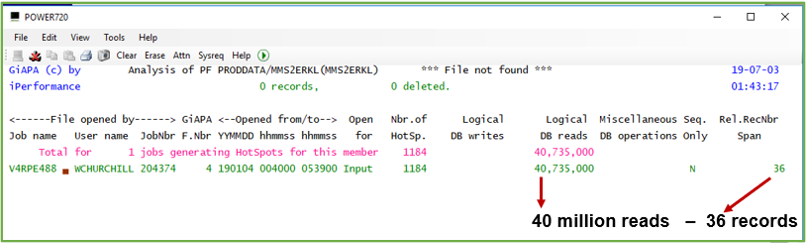
Looking at the data presented in the above example it is obvious the 40 million reads could have been saved by loading this small file into an array at program start.
GiAPA's unique analysis of how files are accessed makes it very easy to spot optimization potential. Position the cursor within the Job Summary report on the job you want to analyze in more details, and hit a command key to reach one of the four reports. Each tell their part of the story - below a couple of examples are explained. We first used F8 to se the analysis of file usage:
Example 3 shows 50+ % optimization potential:
GiAPA tells: 250.792.549 reads were used on <= 1665 records !
The second line on the report shows file R1NCMRW, file number 5 (GiAPA's internal numbering). Data was collected for 1184 intervals, more than enough for basing reliable conclusions on the statistics. 250.792.549 reads were used, but the difference between the highest and the lowest relative record number seen in the 1184 "HotSpot" samples was only 1665 records. GiAPA therefore suggests in the rightmost column that 250.790.884 reads could be saved if each record only was read once (the 1665 records could be stored in a table in memory).
GiAPA also tells that 18 million reads were used to access only one record (probably parameter information) in file number 6. The pink line tells that total potential savings seems to be 422 million I/Os. This should cut run time in half - but see also the example 2: We could do still more here.
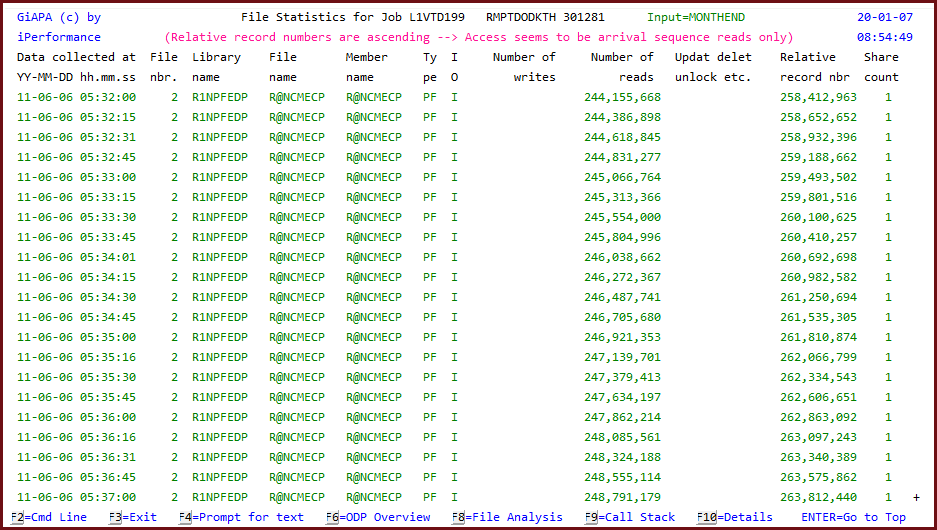
Example 4 reveals that even more could be improved:
Turning to the detailed file statistics report for file 2 (first line on report above) and paging down through all the 1184 samples taken for this file we could see that the relative record number increased all the time (also told by GiAPA in the pink line), and that the number of I/Os and the relative record number were not far apart, meaning that the file was read one record at the time.
It would be MUCH more efficient to read the file in large blocks, and it would only require a very small change in the program source code, if any at all - depending on the type of read used, a change of CL code might suffice.
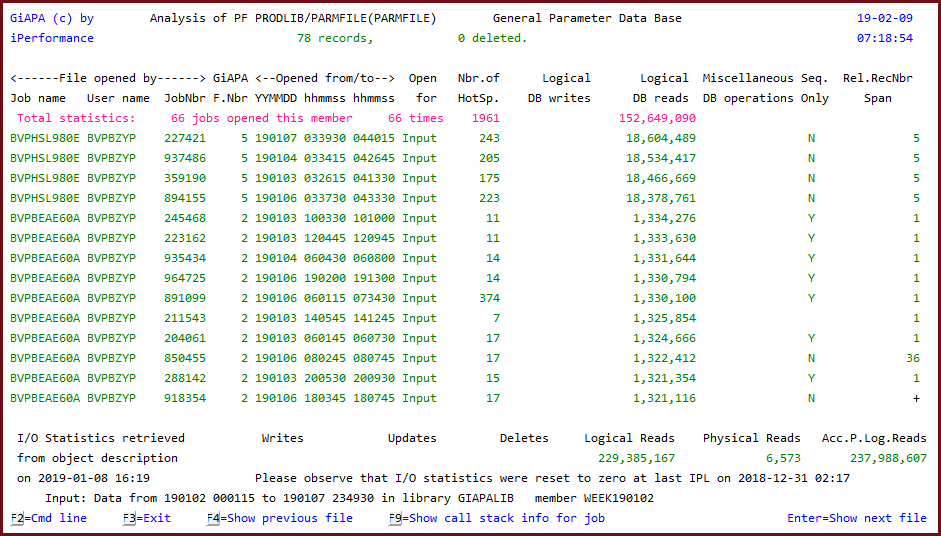
GiAPA's automatic performance analysis of file usage across all jobs makes it even easier to detect file optimization potential. Also the examples above would be listed automatically when selecting this more advanced analysis option shown below.
In the below example GiAPA found a file used by 66 jobs reading this parameter file every time a parameter was needed - for some jobs more than 18 million times. But most of the jobs only needed 5 different parameters, meaning that almost all of these reads could be saved if the program was changed to store the parameter records needed in a table/array within the program.
The call stack details (not shown here) revealing the program and statement number reading the file can be requested by using F9 with the cursor positioned on a job.