Total Resource Usage for one or more LPARs
GiAPA can obviously show totals for resource usage in many ways: For certain jobs or users, for an entire LPAR, even for an entire physical machine. GiAPA Tutorials number 7 and 9 contain more details - here are just two examples:
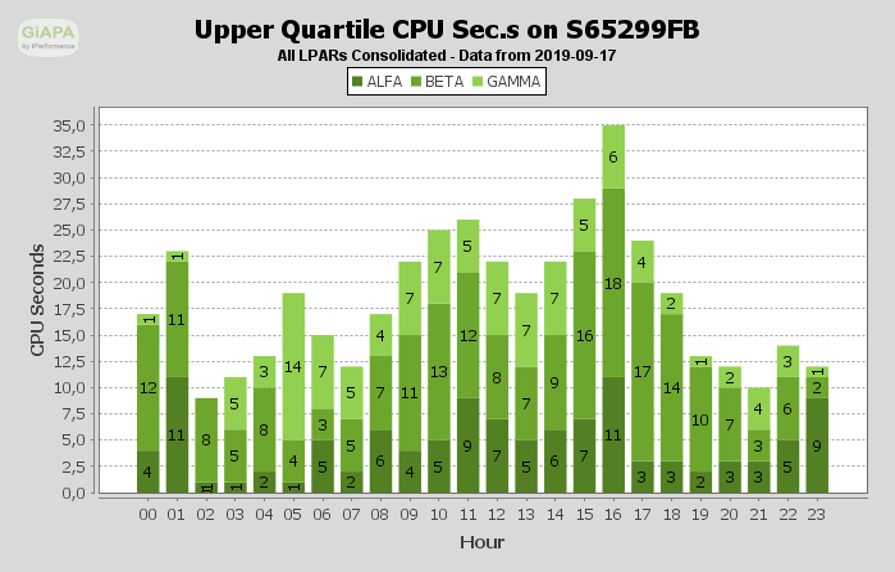
Consolidated CPU usage statistics for all LPARs of a physical machine
Such a chart is very useful to check if one more LPAR fits into a physical machine. Maybe the processor resources in theory are fully "sold out", but if the LPARs involved never peak at the same time and are defined uncapped, there might be room for one more LPAR. GiAPA can be scheduled to automatically FTP-transfer results from different LPAR to one "master" partition, where a chart like the following showing CPU usage for three LPARs may be generated.
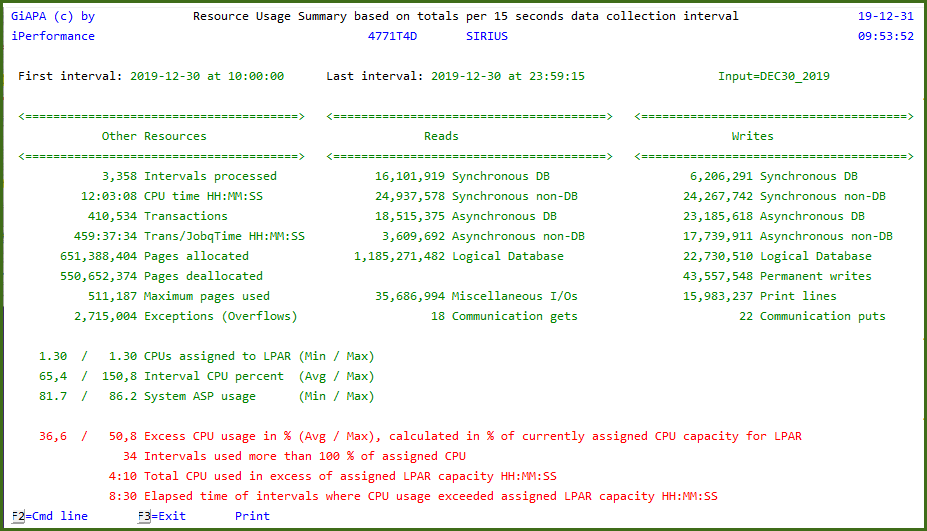
Exact resource usage summaries for an entire LPAR - per day, week, month, or ...
If the LPARs are rented, exact usage statistics might be valuable. The service provider will want to have exact data available for invoicing any excess CPU usage for uncapped partitions, and the customer may want to see WHEN the CPU usage exceeds the agreed 100 % and WHICH JOBS caused that to happen and for HOW LONG and HOW MUCH - maybe this could be avioded by rescheduling a few batch jobs.
GiAPA also features exception reports telling e.g. which jobs used the most CPU when the LPAR CPU % exceeded 100. Below we show another report, a summary page showing totals for all resources used. Note the red lines giving information about CPU usages exceeding 100 % of what was defined for this LPAR, which obviously was running uncapped..