Collection of Performance Data
Runs in batch typically using less than 0.1 % CPU - intended to be active always, so data always is available to pinpoint any performance issues and to produce reports and graphics documenting any type of resource usage and trends.
Collecting comprehensive performance data while only using < 0.1 CPU sounds almost impossible. The explanation is GiAPA's "trade secret", which reduces I/Os to an absolute minimum. The data is not encrypted, but stored in a compressed binary format using field length in bits. The records are packed into 8 K variable length spanned blocks.
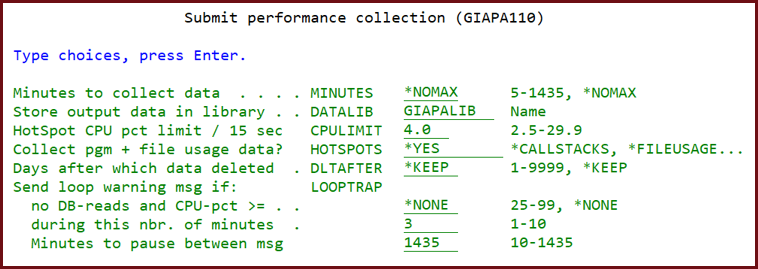
Data collection may be started from the GiAPA menu, but is normally scheduled to start automatically in connection with IPL. A parameter (default value 4.0 %) defines the CPU usage limit which triggers HotSpots: Whenever a job reaches this CPU %, GiAPA will collect additional information for the job thus enabling later detailed performance analysis.
The two very different types of data collected are:
Interval data:
Statistics for use of 22 types of resources (CPU, I/Os, etc.) for all active jobs and tasks are received from an operating system API at 15 seconds’ intervals throughout the entire GiAPA performance data collection run.
These statistics are fairly accurate, but do not include jobs/tasks that both started and ended within one interval. Information for such small jobs is collected from QHSTLOG or job accounting.
HotSpot data:
Open file statistics and program call stacks for jobs having exceeded a user-defined limit for CPU within a 15 seconds’ interval. These snapshot data are true sampling, the contents being similar to the data seen when using command DSPJOB (Display Job) option 11 (Call stack) and 14 (Open Files).
Any heavy job triggers many HotSpots, giving enough samples to give a rather accurate picture. For multi-threaded jobs (where JAVA is the typical example), HotSpot call stack data is collected for the threads using the most CPU.